San Francisco Gun Violence Statistics and Security Insights
San Francisco gun violence statistics tell a story of genuine progress on paper and persistent gaps in practice. Here’s what the data means for security planning in the Bay Area.
Key Takeaways: What Does the Data Tell Us?
San Francisco gun violence statistics have moved in an encouraging direction. The city recorded 35 homicides in 2024, down from 51 in 2023 and well below the pandemic-era peak of 56 in 2021¹. That’s the continuation of a multi-year decline, and it reflects a combination of targeted enforcement, expanded community violence intervention, and focused attention on the neighborhoods where gun violence concentrates.
But the progress on the headline numbers doesn’t tell the whole story.
SFPD is operating with roughly 1,500 sworn officers against an authorized strength of nearly 2,000². That shortage has persisted for years, and the consequences show up where it matters most: response times. When Priority A calls, the category that includes active shootings, consistently exceed the department’s targets², facilities counting on a fast police arrival as their primary security plan are working with an assumption the data doesn’t support.
The Bottom Line Is San Francisco Safe?
- Homicides are at multi-decade lows. The 35 homicides in 2024 represent San Francisco’s lowest total in over 60 years, continuing a sustained downward trend from the 2021 peak¹
- Police staffing remains critically short. SFPD operates roughly 25% below its authorized strength, with direct consequences for emergency response capacity²
- Violence is geographically concentrated. The Tenderloin, Bayview-Hunters Point, and parts of the Mission and SoMa districts account for a disproportionate share of the city’s gun incidents³
- Strong state laws help but don’t eliminate risk. California ranks first in the nation for gun law strength⁴, yet illegal firearms still circulate and urban violence persists
Your own systems matter most in those first minutes. When staffing falls short and response times stretch, the security infrastructure inside your facility is what determines whether a threat gets a fast, coordinated answer or a dangerous gap.
How We Got Here
San Francisco’s gun violence story unfolds against a backdrop that’s fundamentally different from cities in states like Texas or Florida. California has spent decades strengthening its gun laws. Universal background checks, an assault weapons ban, red flag laws, restrictions on high-capacity magazines, a 10-day waiting period. The state ranks first nationally for gun law strength according to the Giffords Law Center⁴, and its firearm death rate sits below the national average.
That legislative environment creates a different starting point. But it doesn’t create immunity.
San Francisco hit its recent peak of 56 homicides in 2021, driven by the same forces that spiked violence in cities across the country¹. Pandemic stress, economic dislocation, disrupted social services, and an accelerating drug crisis, particularly in the Tenderloin, created conditions where gun violence escalated. The open-air drug markets that expanded during COVID weren’t just a public health issue. They became flashpoints for armed conflict.
The city’s response combined enforcement and intervention. Community violence intervention programs, especially those operating in Bayview-Hunters Point and the Tenderloin, received increased funding and expanded their outreach³. These programs focus on identifying the highest-risk individuals and intervening before disputes turn deadly. At the same time, targeted enforcement focused on illegal firearms and repeat offenders.
The results have been real but uneven. Citywide homicide numbers dropped each year from 2022 through 2024. But certain neighborhoods improved faster than others, and the underlyin
Contact Us
With a rich history of innovation, Omnilert is the leading provider of AI Gun Detection.
2024 Gun Violence Data San Francisco Crime Rate Statistics
What’s Happening in Schools
San Francisco hasn’t experienced a mass school shooting in recent years, but the city is not immune to youth gun violence. Teens and young adults in neighborhoods with concentrated violence remain at elevated risk, and incidents involving firearms near school campuses have prompted ongoing concern from parents, administrators, and the San Francisco Unified School District⁵.
The challenge for schools in a city this dense is perimeter control. Many SFUSD campuses sit along busy streets with multiple entry points and limited buffer zones. A school can secure its main entrance, but it can’t control the block around it. When gun violence occurs in the surrounding community, students walk through those areas every day.
Traditional access control measures at the front door are necessary. But the harder question is what happens when a threat originates outside or enters through a secondary point. Detection speed and automated response become the variables that matter most once a physical barrier has been bypassed.
Response Time Reality Check
SFPD’s staffing crisis turns response times from an operational metric into a security planning variable. The department’s authorized strength is 1,971 sworn officers. Actual staffing has hovered around 1,500 in recent years, a gap of roughly 470 officers². Recruitment has been persistently difficult. Bay Area cost of living, competition from suburban departments offering comparable salaries at a fraction of the housing cost, and years of attrition outpacing hiring have all contributed².
What does that mean for facilities counting on a fast response?
- Priority A calls (imminent life threats): response times have averaged above the department’s five-minute target, with some reporting periods showing averages closer to seven minutes²
- Priority B calls (urgent, not immediately life-threatening): response times stretch well past targets, sometimes into tens of minutes
- Lower-priority calls: wait times measured in hours are not uncommon
For context, active shooter events are typically over within three to five minutes. If your security plan starts with “call 911,” you’re building around a response that may arrive after the critical window has closed.
The city has tried to supplement police presence with community ambassador programs and private security in high-traffic areas like Union Square and the Tenderloin⁶. These programs help with deterrence and quality-of-life concerns. They are not designed to intervene in an active gun threat.
Healthcare and Government Facilities
San Francisco’s healthcare workers face elevated violence risks. Zuckerberg San Francisco General Hospital, the city’s only Level 1 trauma center, treats the majority of gunshot wound patients and operates in an environment where tensions run high and security incidents are a persistent concern. California’s SB 553, which took effect in July 2024, now requires virtually all employers to implement workplace violence prevention plans, a legislative acknowledgment of the scale of the problem⁷.
Government buildings in San Francisco face the inherent tension between public accessibility and security. City Hall, neighborhood service centers, and other civic facilities need to remain open. Entry screening works at controlled access points, but many of these buildings have multiple entrances, public meeting spaces, and open layouts that challenge traditional security models.
- 1 Min
-
2 Min
WEAPON VISIBLE BY CAMERA
Omnilert’s Gun Detection can detect guns and trigger a full-scale response within seconds, before shots are fired.
- 3 Min
AI Gun Detection How Gun Detection Can Save You Critical Time to Protect Lives
After tragedies like the Parkland shooting, the need for rapid threat detection in schools has grown urgent. Omnilert’s AI gun detection delivers critical early warnings and triggers an automated response, helping schools act quickly to protect lives when every second matters.
Five Years of Change in San Francisco (2020-2024)
Five years of data reveal three distinct chapters:
The Crisis (2020-2021): Pandemic conditions drove gun violence upward. San Francisco recorded 48 homicides in 2020 and 56 in 2021¹. The Tenderloin and Bayview-Hunters Point bore the brunt. Open-air drug markets expanded, homelessness intensified, and the social services designed to intervene in violence were disrupted at exactly the moment they were most needed.
The Pivot (2022-2023): Violence started declining, though unevenly. The city increased investment in community violence intervention programs targeting the highest-risk individuals and locations³. Homicides dropped to the mid-40s by 2023. Political debate swung between calls for stronger enforcement and concerns about civil liberties, shaping policy in real time.
Stabilization (2024): With 35 homicides, San Francisco reached its lowest point in over 60 years¹. The improvement is genuine. But it coexists with a police department that’s hundreds of officers short and response times that still exceed targets.
The open question: is this a durable shift or a temporary low? The conditions that drove the 2020-2021 spike, including drug markets, economic pressure, and concentrated poverty, haven’t been resolved. They’ve been managed. Whether that management holds depends on sustained investment in both intervention programs and security infrastructure.

The Longer View (Ten Years Out)
Zoom out to a decade and the picture gets more complex. San Francisco in 2015 was grappling with a tech-driven economic boom that was reshaping neighborhoods, a growing homelessness crisis, and the early stages of an opioid epidemic that would later merge with fentanyl.
Over those ten years, the total homicide count has fluctuated within a relatively narrow band, roughly 35 to 56. That’s a tighter range than many peer cities, but it still represents dozens of families shattered each year. And the concentration of violence in a handful of neighborhoods means the experience of gun violence is deeply unequal across the city.
California’s legislative approach during this period has been consistently proactive. The state has expanded background check requirements, restricted ghost guns, strengthened red flag law enforcement, and maintained its assault weapons ban⁴. At the state level, these measures have contributed to firearm death rates well below the national average.
For security planners, the most important trend isn’t whether violence is going up or down year to year. It’s the persistent gap between when an incident begins and when help arrives. That gap hasn’t closed with staffing improvements, because the staffing improvements haven’t materialized. Organizations investing in visual gun detection, automated response protocols, and integrated communication systems are the ones compressing that timeline from minutes to seconds.
Where Traditional Security Falls Short
San Francisco’s data highlights vulnerabilities we see across the country, amplified by some distinctly local factors:
Response time gaps are structural, not temporary. SFPD’s staffing shortage isn’t a blip. The cost of living in San Francisco makes recruitment and retention a systemic challenge that won’t resolve quickly. Building a security plan around fast police response means building on a foundation that isn’t reliably there.
Urban density creates exposure you can’t wall off. In 47 square miles of dense cityscape, facilities sit adjacent to high-traffic areas, public transit corridors, and open spaces where threats can emerge without warning. Security focused solely on building interiors misses where risk often starts.
Outdoor areas are undermonitored. Research indicates a significant share of gun violence incidents occur in outdoor settings⁸. San Francisco’s parks, plazas, campus quads, and street-facing entries represent significant exposure that most traditional security configurations don’t adequately cover.
Access control is necessary but not sufficient. Urban facilities often have multiple entrances, loading areas, emergency exits, and ground-level windows. A controlled main entrance works until someone finds another way in.
Fragmented communication costs critical time. When an incident occurs, getting verified threat information simultaneously to building occupants, security personnel, and first responders is a challenge most organizations still haven’t solved. Sequential notification, where one group waits while another is informed, burns minutes that determine outcomes.
How Omnilert Can Help Improving Security Systems with New Technologies
Building Better Protection Against Gun Violence
Effective gun violence prevention requires layered approaches that address threats at different stages:
Early detection matters most. Systems that identify weapons before shots are fired provide advance warning that traditional approaches can’t match.
Speed beats perfection. Automated systems that respond instantly often perform better than perfect procedures that take time to implement.
Coverage needs to be comprehensive. Both indoor and outdoor monitoring are essential, since threats can start anywhere.
Integration amplifies everything. Connected systems that share information and coordinate responses work better than isolated security measures.
Related Resources Related Security Resources for San Francisco, CA
 Article
Omnilert’s 2024 Gun Violence Report: Fewer Overall Incidents, but School Deaths and Injuries Are on the Rise
503 mass shootings in the U.S. and 330 incidents in schools highlight the ongoing need to provide layers of protection including…
Read Article Article
Omnilert’s AI Gun Detection Receives the Full SAFETY Act Designation from the U.S. Department of Homeland Security
Omnilert’s AI Gun Detection technology has received the full SAFETY Act designation from the U.S. Department of Homeland Security,…
Read Article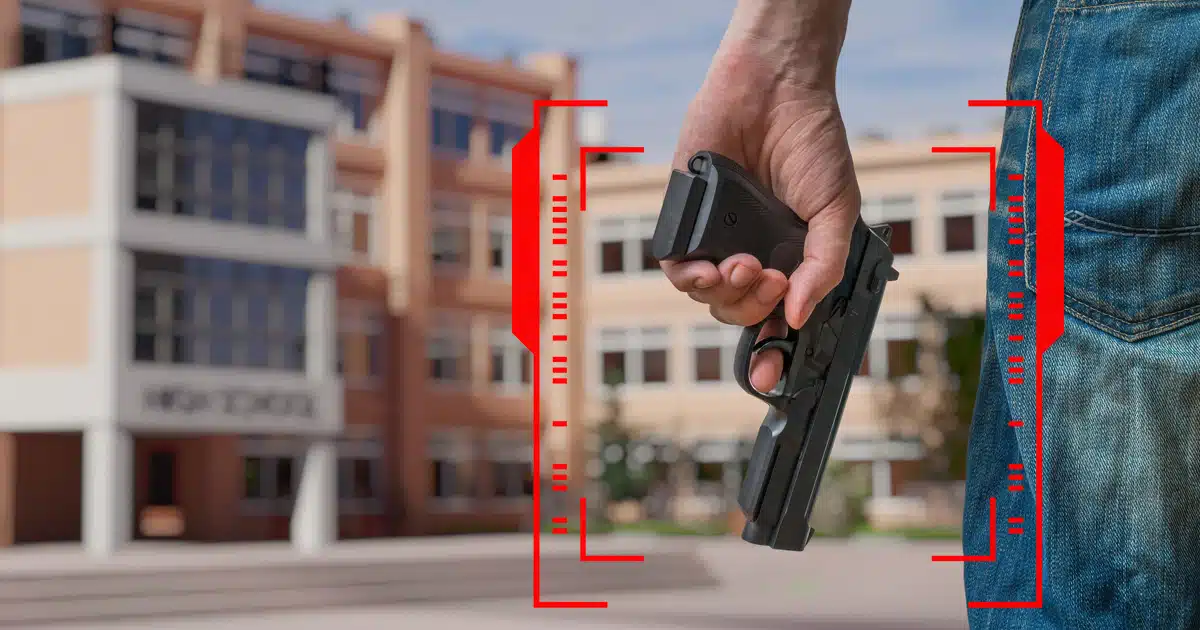 Article
What is Visual Gun Detection? Technology, Training, and Impact
Learn how AI-powered visual gun detection leverages deep learning and real-world training to enhance security, trigger real-time alerts,…
Read ArticleSources
- San Francisco Mayor and SFPD Chief Bill Scott. “Homicides in San Francisco Reach Historic Low Not Seen in Over 60 Years.” SF.gov, December 10, 2024. https://www.sf.gov/news–mayor-breed-and-sfpd-chief-bill-scott-announce-homicides-san-francisco-reach-historic-low-not
- San Francisco Board of Supervisors. “Performance Audit of San Francisco Police Department Overtime.” December 2024. https://sfbos.org/sites/default/files/121224_Performance_Audit_of_Police_Dept_Overtime.pdf
- San Francisco Government. “San Francisco Ambassador Programs.” February 13, 2024. https://www.sf.gov/reports–february-2024–san-francisco-ambassador-programs
- Giffords Law Center. “Annual Gun Law Scorecard: California.” 2024. https://giffords.org/lawcenter/resources/scorecard/
- NBC Bay Area. “San Francisco sees historic drop in violent crime in 2024.” 2025. https://www.nbcbayarea.com/news/local/san-francisco-historic-drop-violent-crime/3733222/
- San Francisco Government. “Community Ambassadors Program.” SF.gov. https://www.sf.gov/community-ambassadors-program
- California Department of Industrial Relations. “Cal/OSHA Workplace Violence Prevention Guidance and Resources.” https://www.dir.ca.gov/dosh/workplace-violence.html
- Everytown for Gun Safety. “Gun Violence in America.” Everytown Research & Policy, 2024. https://everytownresearch.org/report/gun-violence-in-america/s-changes-to-fill-over-150-vacancies/3381384/

